Transforming Data into Visual Stories: The Power of an Infographic Label Elements Set
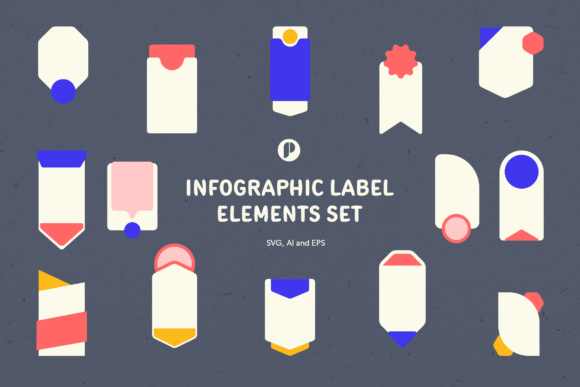
In a world saturated with information, the ability to distill complex data into a compelling visual story is not just a skill—it’s a necessity. For professionals, educators, marketers, and creators, an Infographic Label Elements Set represents a practical toolkit for achieving this clarity without sacrificing design integrity. This collection is more than just clip art; it’s a structured system of 15 distinct label designs, crafted in a soft, engaging color palette with a bold blue accent, designed to make your infographics both functional and visually appealing.
The Modern Demand for Visual Efficiency
Our communication habits have evolved rapidly. The expectation for quick comprehension has pushed detailed reports and lengthy documents to the background, favoring formats that deliver insight at a glance. This shift is evident across social media feeds, corporate presentations, educational materials, and marketing campaigns. An infographic serves as a visual shortcut, bridging the gap between raw data and audience understanding. However, creating a professional-looking infographic from scratch demands significant time and design expertise, which many busy professionals lack. This is where a pre-designed, editable element set becomes invaluable, fitting seamlessly into modern workflows that prioritize efficiency and quality.
The relevance of such a tool extends beyond mere convenience. It addresses a core business need: effective communication. Whether explaining a new process to employees, showcasing product features to customers, or summarizing research findings, a well-designed infographic boosts engagement and retention. The Infographic Label Elements Set directly supports this by providing a foundation that is both aesthetically consistent and flexible.
Beyond Static Graphics: A Foundation for Creative Variation
A common misconception is that using pre-made elements leads to generic, repetitive designs. The true value of a high-quality set lies in its capacity for variation. With 15 different label shapes—from rounded callouts to angular badges—this set allows creators to assemble multiple infographics with entirely different layouts and feels. The well-organized layers and properly named files, as noted in its features, mean you aren’t battling a chaotic file to make changes. Editing colors, adjusting curves, and scaling elements becomes a straightforward task, not a technical ordeal.
This ease of editing is crucial for adapting to different platforms. The same core data might need a square, dense infographic for a LinkedIn post, a vertical, flowing one for a poster, and a simplified version for a PowerPoint slide. The scalable SVG, AI, and EPSv8 file formats ensure that from digital screens to print media, your graphics remain sharp at 300 dpi RGB. This technical flexibility empowers users to maintain a professional brand presence across all touchpoints.
Practical Implications for Diverse Users
Let’s consider realistic applications. A small business owner launching a new service can use the label elements to create a social media infographic highlighting key benefits, using the bold blue to draw attention to the main offering. A freelance consultant might integrate these labels into a client presentation to visually break down project phases, using the softer colors to create a mild, approachable vibe that doesn’t overwhelm. An educator could employ the various shapes to create a classroom poster that categorizes historical events, making the information more accessible to students.
The implications are deeply practical. For the non-designer, it removes the barrier of starting from a blank canvas. For the seasoned designer, it provides a time-saving asset library that can be customized to fit any project theme. The infographic labels act as building blocks, enabling users to focus on the narrative and data structure rather than the minutiae of shape creation and color harmony.
Aligning with Design Trends and Audience Expectations
Current visual trends lean towards clean, functional design with a touch of personality. The described color combination—soft tones punctuated by a bold blue—hits this mark perfectly. It feels contemporary without being harsh, fun without being childish. This aesthetic balance is key for engaging the broad adult audience of 20 to 50, who appreciate clarity but are wary of overly corporate or frivolous design.
Furthermore, the trend towards content repurposing is strong. A single investment in a versatile element set allows for the creation of a whole suite of related visuals for a campaign or report. This aligns perfectly with the economic and strategic needs of entrepreneurs and marketers looking to maximize their content output. The ability to “create as many infographics as possible with different looks” from one set is a direct answer to this need for scalable content creation.
Building a Functional and Informative Composition
The ultimate goal is to create an infographic that is both informative and appealing. The functionality comes from the logical arrangement of your data using the labels as containers for statistics, steps, quotes, or features. The appeal is generated by the cohesive design language the set provides. When you use these elements, you ensure a uniform style for all your labels, which creates a professional, trustworthy visual hierarchy.
A recommended approach is to start with your core message. Identify the key data points or steps. Then, select label shapes from the set that best suit each type of information—perhaps a ribbon label for a headline figure, a rounded box for a supportive detail, and a tag shape for a quick tip. Leverage the bold blue for your most critical data to guide the viewer’s eye. This methodical use of the toolkit transforms a list of facts into a guided visual journey.
In practice, this means your infographic won’t just look “nice.” It will work. It will communicate more effectively than a bullet-point list or a plain chart. It meets the audience’s expectation for digestible, engaging content, whether they are a colleague scanning a presentation, a potential customer browsing social media, or a student learning from a poster.
An Asset for Sustainable Creative Practice
For creators and professionals, sustainable workflows are essential. Burning hours on repetitive design tasks is neither productive nor creative. Integrating an Infographic Label Elements Set into your asset library changes that dynamic. It becomes a go-to resource, a reliable starting point that accelerates production without locking you into a single style. This supports a more dynamic and responsive creative practice, where you can adapt to last-minute requests or iterate on designs quickly based on feedback.
The evolution here is clear: design tools are moving towards empowerment, not just provision. This set offers the building materials and the blueprint (through its organization), but you remain the architect. You decide the final structure, the narrative flow, and the specific application. This balance of guidance and freedom is why people are paying more attention to such specialized design resources—they represent a smart investment in both time and output quality.
As visual communication continues to dominate our professional and personal landscapes, having the right tools at your fingertips is no longer a luxury. It’s a prerequisite for clear, impactful communication. The thoughtful construction of this particular set—from its variety of shapes to its editable, scalable file formats—makes it a pragmatic choice for anyone ready to transform their data into stories that are seen, understood, and remembered.